![[3-circle Venn diagram -- click me for main page]](gifs/smallV3plain.gif)
|
| THE ELECTRONIC JOURNAL OF COMBINATORICS (ed. June 2005), DS #5. |
![[Venn diagram 'Victoria']](gifs/VictoriaIcon.gif)
There are many geometric aspects of Venn diagrams and generalizations that have been considered in the literature. We have seen some diagrams already whose form is motivated by geometric issues; for example, Venn diagrams made from circles, ellipses, rectangles, triangles, and a 7-Venn diagram whose curves are non-convex 5-gons.
Several articles discuss the geometric procedures used to draw Venn diagrams. Glassner [Gl] discusses some of the computational aspects of generating diagrams using Edwards' construction [Ed89a]. The survey article of Hamburger [Ha98b] contains a wealth of material on geometric aspects of Venn diagrams, particularly convexity issues.
It is interesting to note that Venn himself, in the final chapter of his book [Ve81], speaks in no uncertain terms of his opinions of these geometric considerations:
My own conviction is very decided that all introduction of considerations such as these should be avoided as tending to confound the domains of Logic and Mathematics; of that which is, broadly speaking, qualitative, and that which is quantitative. The compartments yielded by our diagrams must be regarded solely in the light of being bounded by such and such contours, as lying inside or outside such and such lines. We must abstract entirely from all consideration of their relative magnitude, as we do of their actual shape, and trace no more connection between these facts and the logical extension of the terms which they represent than we do between this logical extension and the size and shape of the letter symbols, A and B and C. - quoted in [EE] (our emphasis)
A Venn diagram is convex if the interior of each of its curves is convex. Note that the regions of a Venn diagram can alway be made convex, for example, by taking the Tutte embedding11 of the diagram. Grünbaum defines a stronger notion of convexity by insisting that not only are the curves convex, but also regions and the complement of the external region; we call this condition strong convexity.
Every monotone Venn diagram is isomorphic to a convex diagram via the following result of Bultena, Grünbaum, and Ruskey [BGR]. A FISC is a family of Finitely Intersecting Simple closed Curves in the plane, with the property that the intersection of the interiors of all the curves is not empty. Clearly, every Venn diagram is a FISC. A FISC is monotone if its directed dual graph has a unique source and a unique sink; this corresponds with our definition of a monotone Venn diagram.
Theorem [BGR]. A FISC has a convex drawing in the plane if and only if it is monotone.
It is known (by construction, see, for example, [RRS], [PS], [Gr75], and [BR]) that there exists a convex n-Venn diagram for every positive value of n, and thus by the above result there is a monotone one as well.
Let the term k-gon designate any convex polygon with at most k sides. Observe that two k-gons can (finitely) intersect with each other in at most 2k points; for the purposes of this discussion we can treat a circle as a 1-gon and an ellipse as a 2-gon. We start off with a lemma first observed by Grünbaum [Gr75], and discuss its consequences.
Lemma G. For a simple n-Venn diagram of k-gons to exist, k > ceiling[ (2n-1 - 1) / C(n,2) ] .
Proof: Given a diagram of k-gons, the number of vertices contributed by any two of them can be at most 2k, so the number of vertices must be at most 2 k C(n,2). Since the number of vertices in a simple diagram is 2n - 2, the inequality follows.
The following table lists implications of Lemma G. The column for k shows the minimum k required for a simple n-Venn diagram of convex k-gons to exist.
| n | k > | Notes on open cases |
|---|---|---|
| 3 | 1 | Classic 3-circle diagram. |
| 4 | 2 | Many known examples with (for example) ellipses, triangles, etc. |
| 5 | 2 | Many known examples of symmetric and non-symmetric diagrams for ellipses, triangles, etc. Conjectured to not be possible for squares by Grünbaum [Gr92b]. |
| 6 | 3 | Solved for triangles by Carroll [JC]. No congruent examples known. |
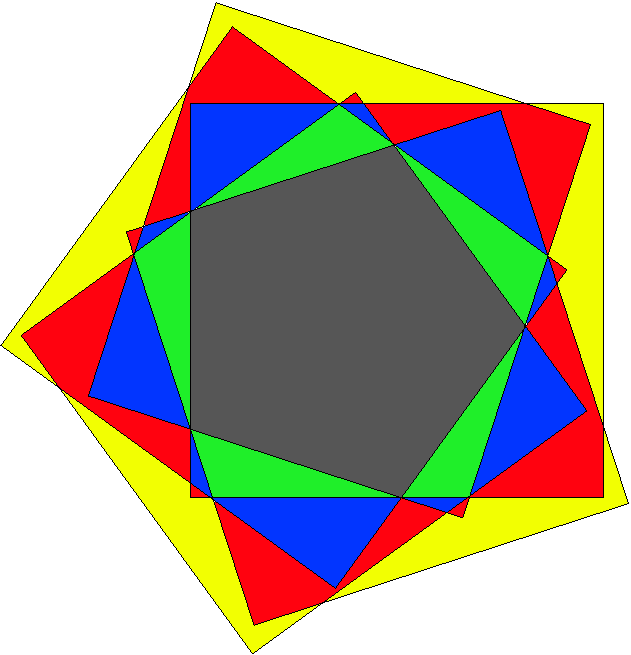
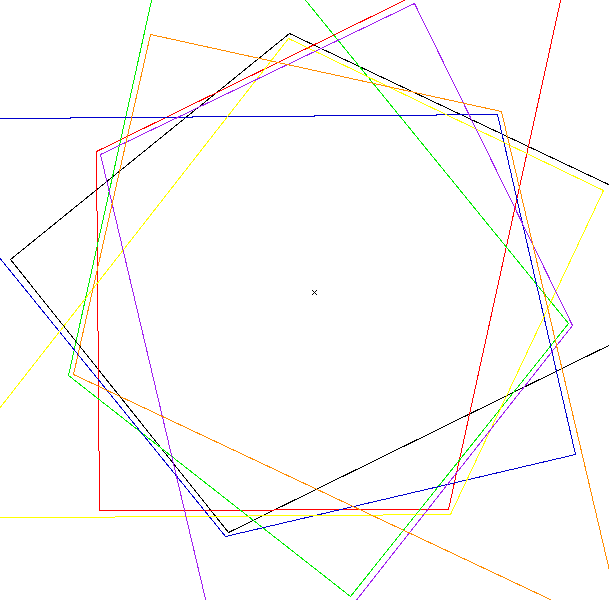
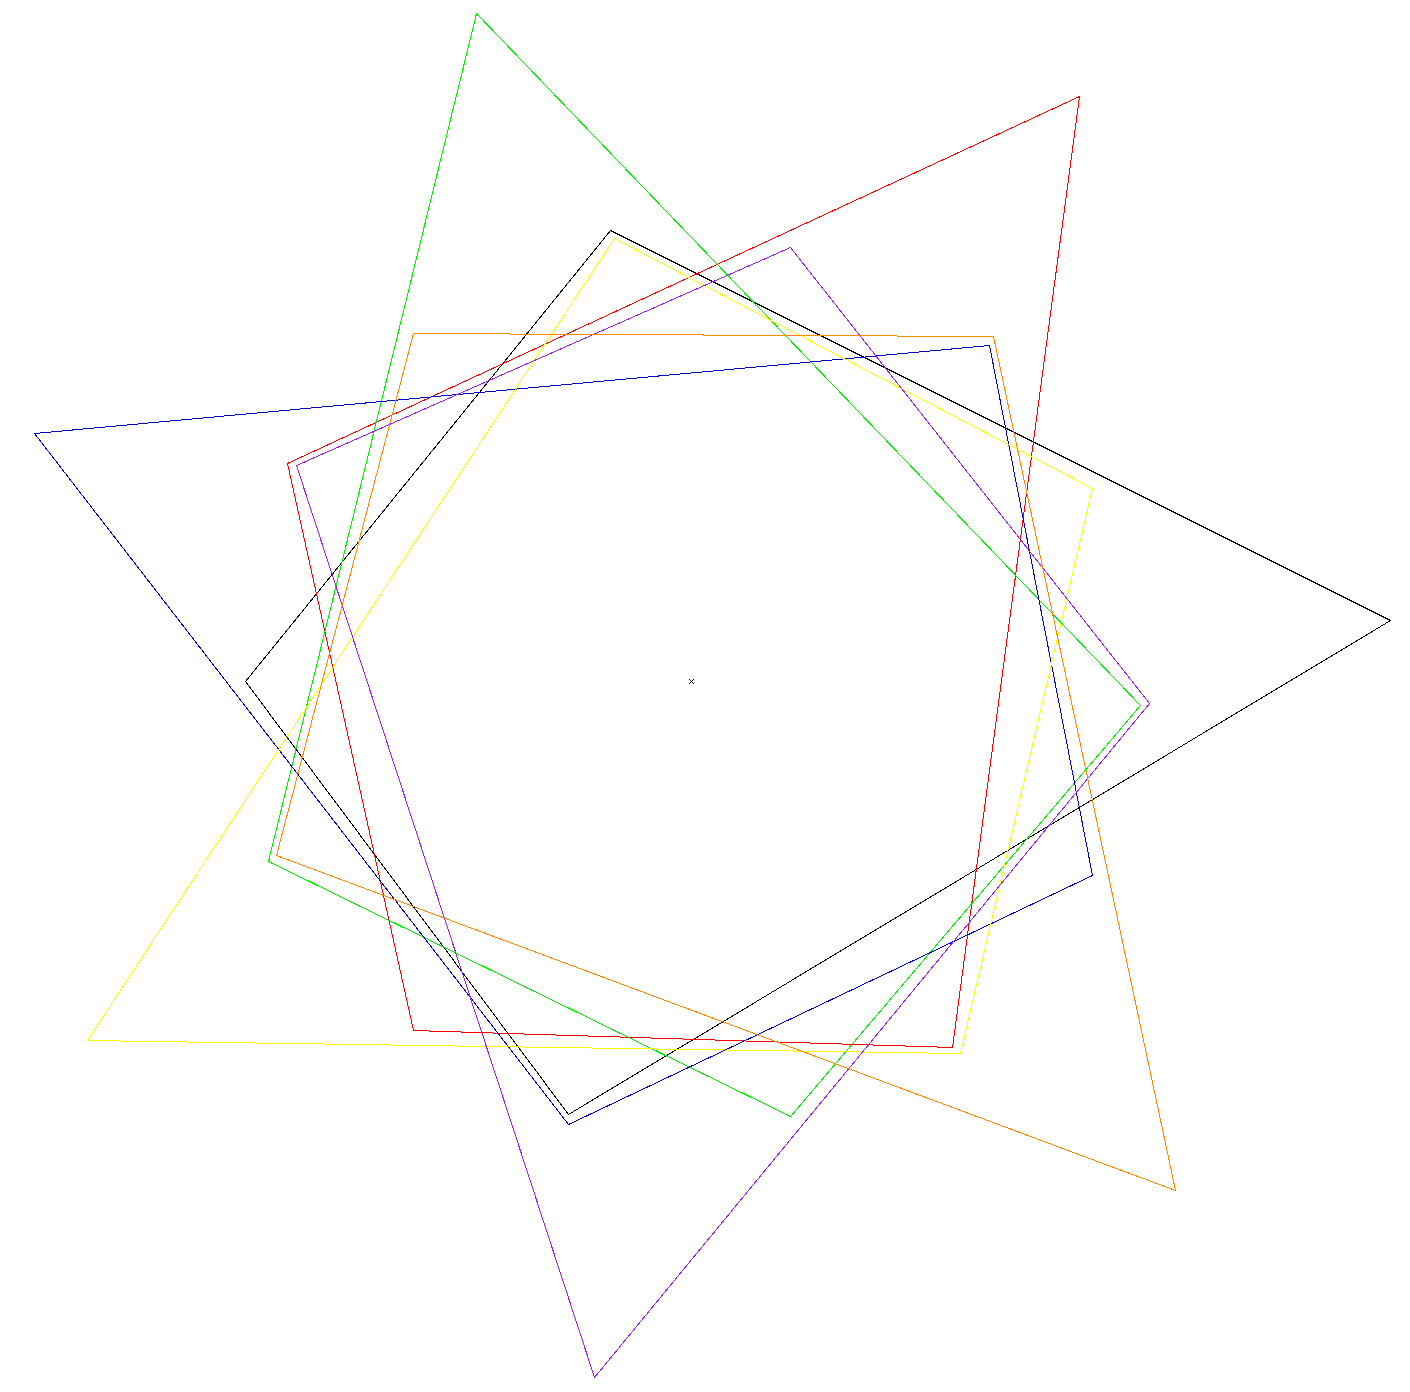
| 7 | 3 | Grünbaum has constructed an independent family (not a Venn diagram) of seven hexagons. Solved recently for convex symmetric 4-gons (image of center of diagram, full version) by the authors. Carroll [Car05] has proved that a diagram of 7 triangles is impossible. |
| 8 | 5 | All small cases open. k < 64 by [Gr75]. |
| 9 | 8 | k < 128 by [Gr75]. |
| 10 | 12 | k < 256 by [Gr75]. |
Jeremy Carroll of HP Labs (Bristol, England) [Car00] solved the problem of finding a collection of six triangles that form a Venn diagram:
| Six amazing triangles |
Carrol [Car05] has proved that triangles cannot be used to construct a 7-Venn diagram; the proof for the simple case is quite short.
Lemma C. A simple Venn diagram of 7 triangles is impossible.
Proof: Assume such a diagram exists. By counting the number of vertices, as in Lemma G above, we see that 6C(7,2) = 27 - 2; thus, every pair of triangles must intersect in six points. Thus for any corner A of any triangle t, and any other triangle t', A lies outside t'. Thus A lies on the outer face of the diagram, and the other face at A is the one inside t alone. Since the same argument holds for a second corner B of t, we have that the non-outer face at A is also the non-outer face at B, but an edge of t' separates them. Thus we have a disconnected region, which contradicts the fact that the diagram is a Venn diagram.
Note that many constructions for Venn diagrams produce diagrams of k-gons where the value k is a function of n (for examples, see [PS] or [Gr75]), and in particular any construction in which the resulting diagrams are monotone yield a convex drawing by the Theorem of [BGR], discussed above. Grünbaum's convex construction [Gr75] is very much like Edwards' general construction, except that the circle is replaced by a square and the nth curve is a 2n-2-gon; this gives the upper bounds in the table above. Also, Grünbaum [Gr75, pg. 17] states that "the construction we used ... is a modification to convex polygons of the method described in More [Mo]."
A Venn diagram is exposed if each of its curves touches the
outer face at some point of non-intersection.
Note, for example, that the 3-Venn diagram #3.2 is not exposed, even
though all curves have a point of intersection on the outer face.
Stated in terms of n-Venn dual graphs, being exposed is
the same as the condition
that the vertex corresponding to the outer face has degree n.
Every symmetric Venn diagram must be exposed (obvious) and
every convex Venn diagram must be exposed
([Gr92a]).
A curve in a Venn diagram is hidden if it
does not touch the outer region.
For example, in Venn's general construction, curves 4,5,...,n-1
are all hidden.
Chilakamarri, Hamburger, and Pippert
[CHP96b] gave an example, shown below,
of a simple 6-Venn diagram which is not in the same class as
any exposed diagram.
The hidden curve is the dotted green one.
![[Exposureless diagram]](gifs/hidden6.gif)
All simple Venn diagrams with five or less curves are exposed, but with five curves there are 8 (5 reducible, 3 irreducible) that do not have a convex drawing in the plane [HP97].
The examples below show a) a traditional Venn diagram representing a weighted data set versus b) its corresponding weighted area-proportional version.
![[Area-proportional Venn diagram example]](pngs/areaprop.png)
For n > 3, the software DrawEuler [DE] uses arbitrarily non-convex curves to represent data sets. The problem is still uninvestigated for specific curves.
A convenient way to build such diagrams is on the grid; each polyomino is axis-aligned and each region is a connected series of unit squares. Thompson has found several examples of congruent Venn polyominoes for n up to 4 sets, and Chow and Ruskey found an example for 5 sets; we show some of these below.
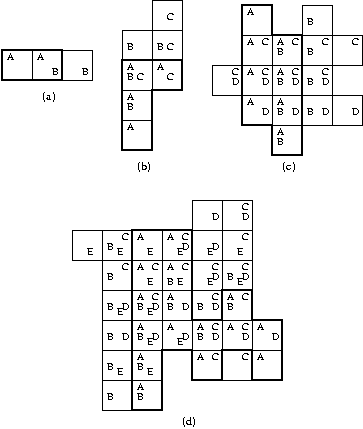
The examples above all have the nice property that they have minimum area: each region is a single unit square.
Chow and Ruskey have also found non-congruent Venn polyominoes for 6 and 7 curves each; these diagrams, and their component curves, can be seen on the following page:
| Venn diagrams from polyominoes for 6 and 7 sets |
Chow and Ruskey also gave a 3/2-approximation algorithm to construct Venn polyominoes; that is, their algorithm produces Venn polyominoes with at most 3/2 times the minimum area (which is, of course, 2n-1 unit squares). Their algorithm produces diagrams whose area is 1 + O(1 / n½) times the minimum area, so they are asymptotically optimal since as n increases the number of regions approaches 2n-1. Like the diagrams constructed by [GKS] on the page Symmetric Diagrams, Necklaces, and Chains, their construction uses a symmetric chain decomposition of the Boolean lattice to specify how to lay out regions.
|
| THE ELECTRONIC JOURNAL OF COMBINATORICS (ed. June 2005), DS #5. |