Venn Diagram Survey
Venn Diagrams from Polyominoes for 6 and 7 Sets
[n=6 | n=7 ]
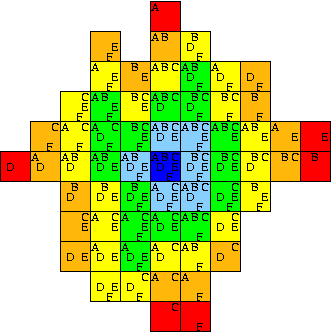
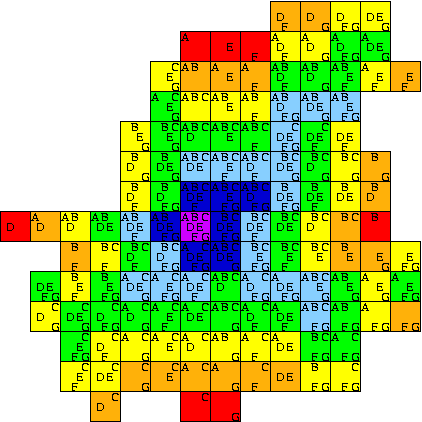
Shown below is a 6-Venn diagram formed entirely from curves drawn
from axis-aligned edges. It is a minimum-area
diagram; that is, each region is composed of a single square of unit area. Note that many edges overlap, so the diagram
is infinitely intersecting. As with many other diagrams in these pages, regions are coloured by weight. The diagrams on this page are from [CR05].
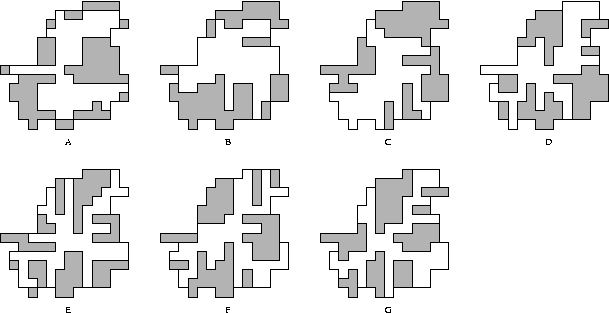
The six component curves of the diagram, overlaid on a grayed-out version of the entire diagram:
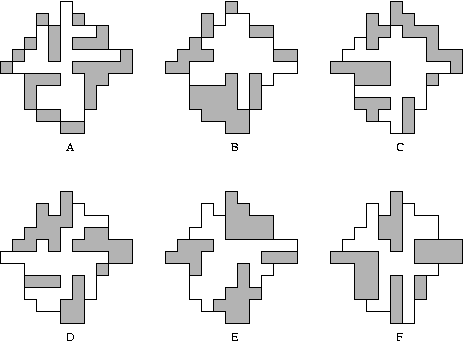
This is a 7-Venn diagram formed entirely from curves drawn from
axis-aligned edges. Like the above it is minimum-area
and infinitely intersecting.
The seven component curves: